Generate submission reports
Tabs
This guide will show you how to use the Charts feature to visualize and analyze your submission data. You can create reports with charts using different form fields and customize them to fit your needs.
Generate a report
-
Go to the Submission page.
-
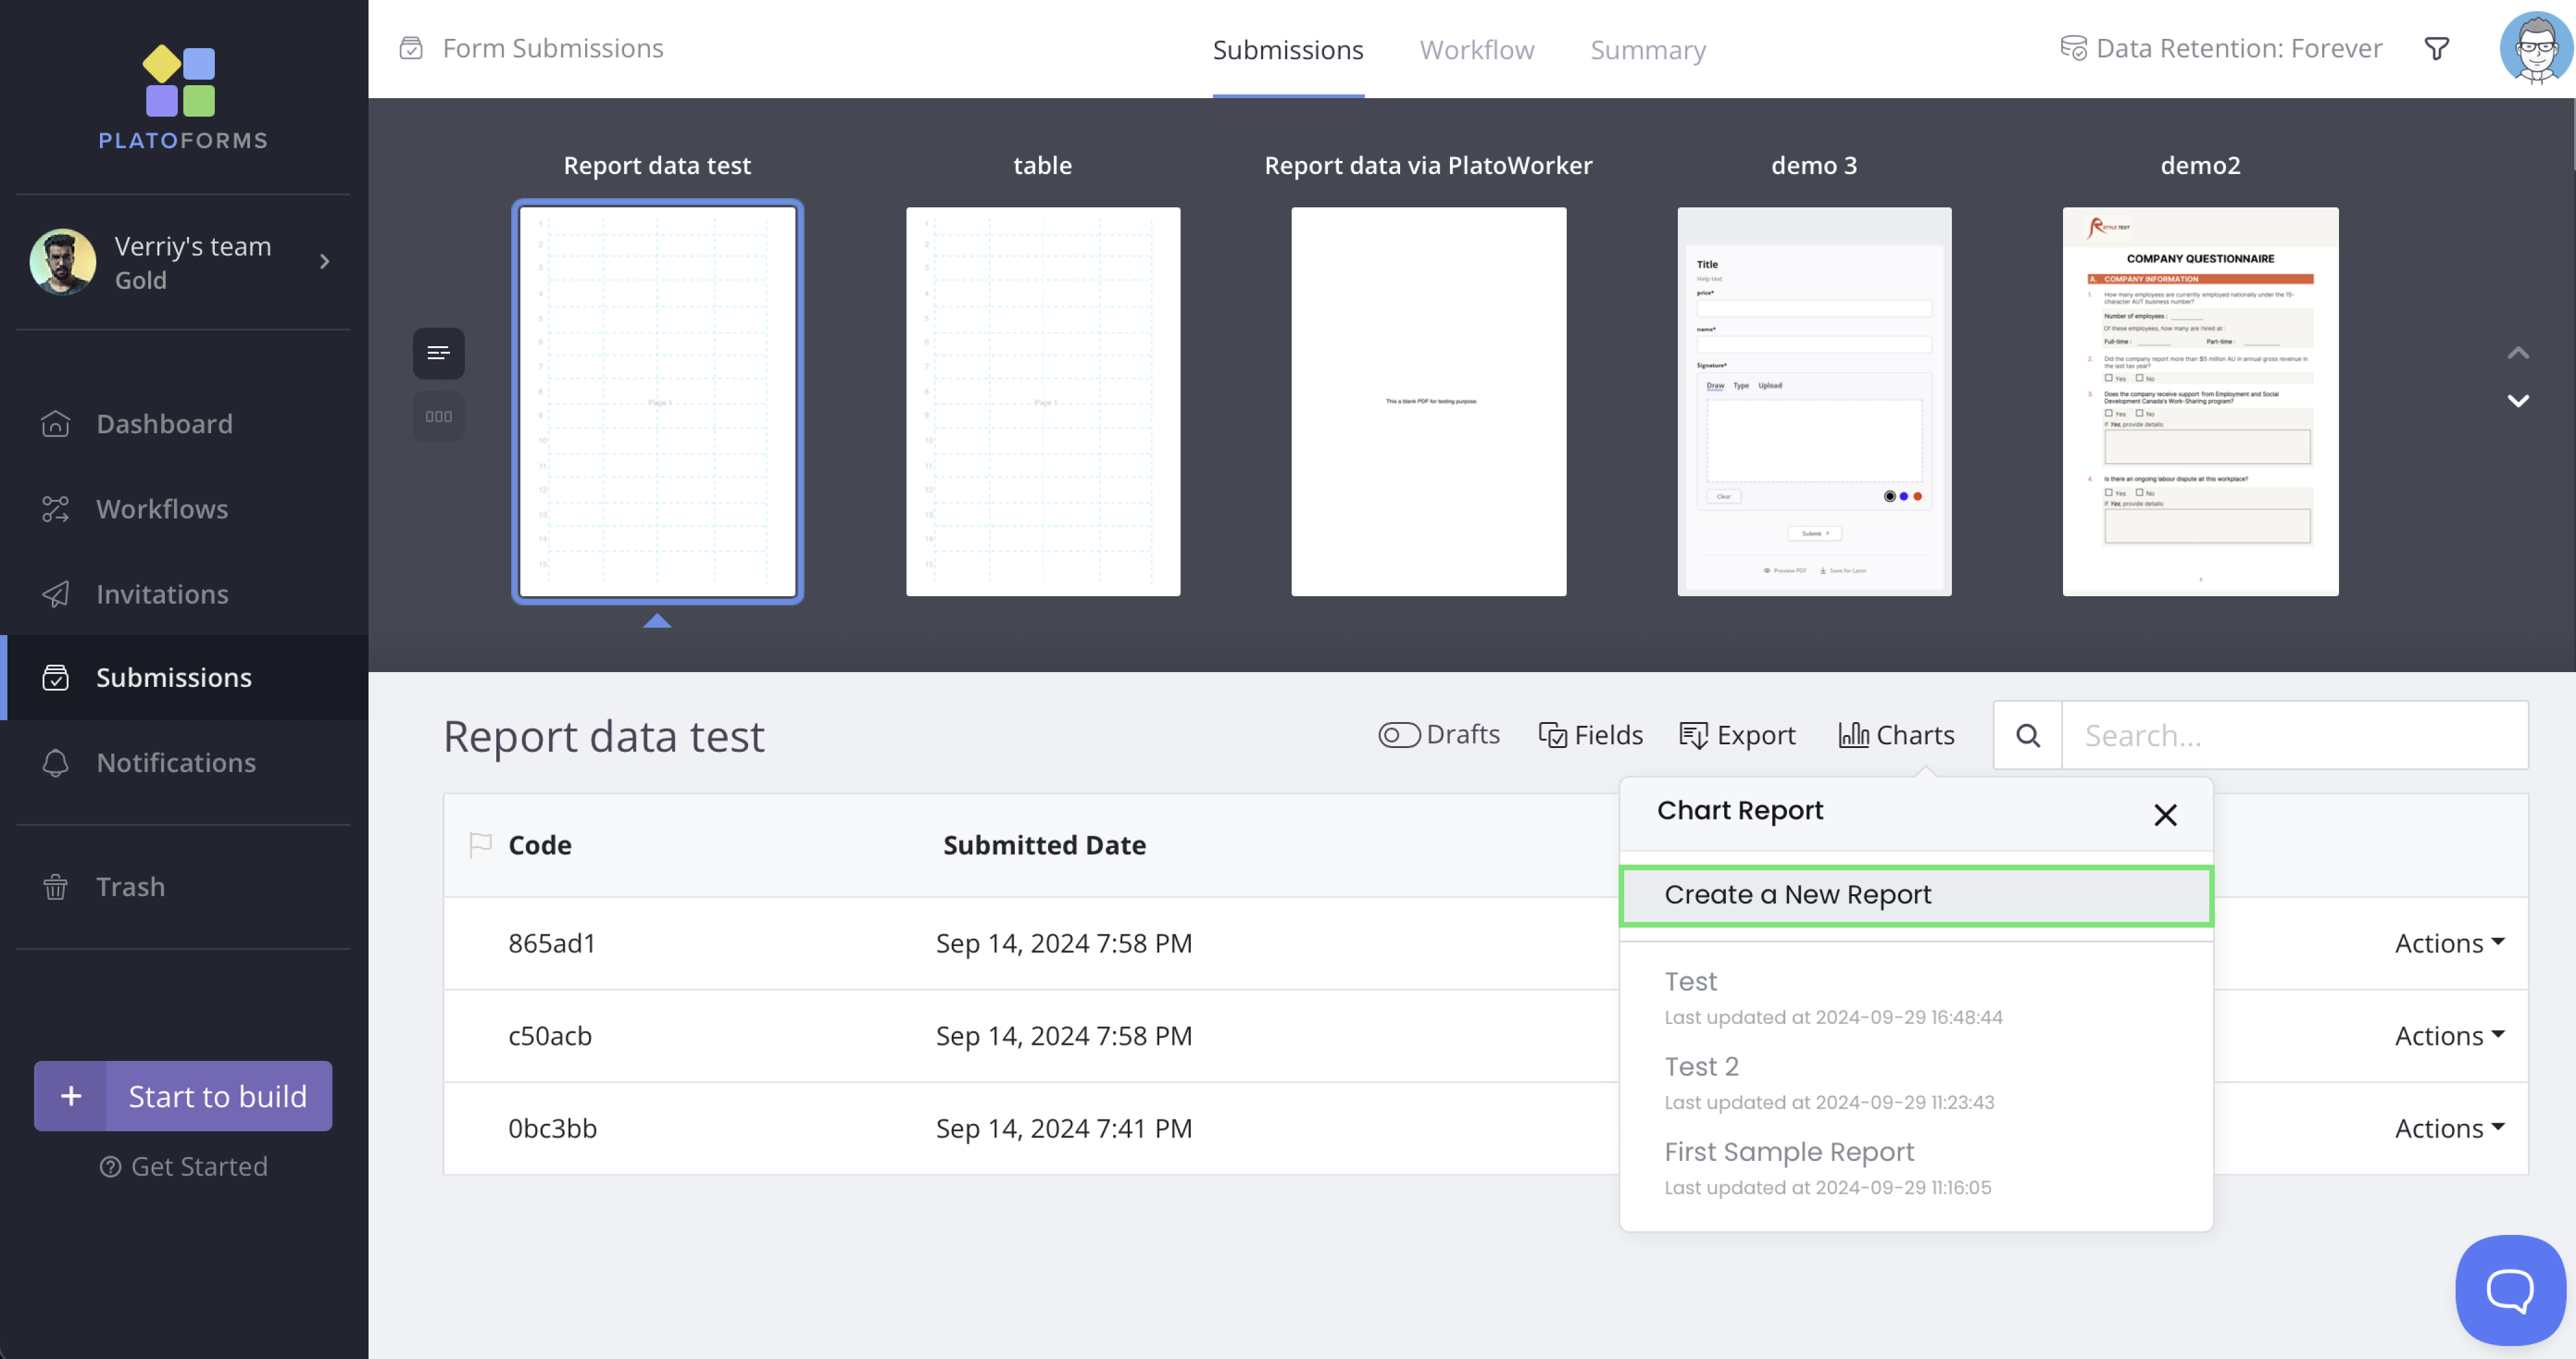
Select the form for which you want to generate a report, and click Charts > Create a New Report.
-
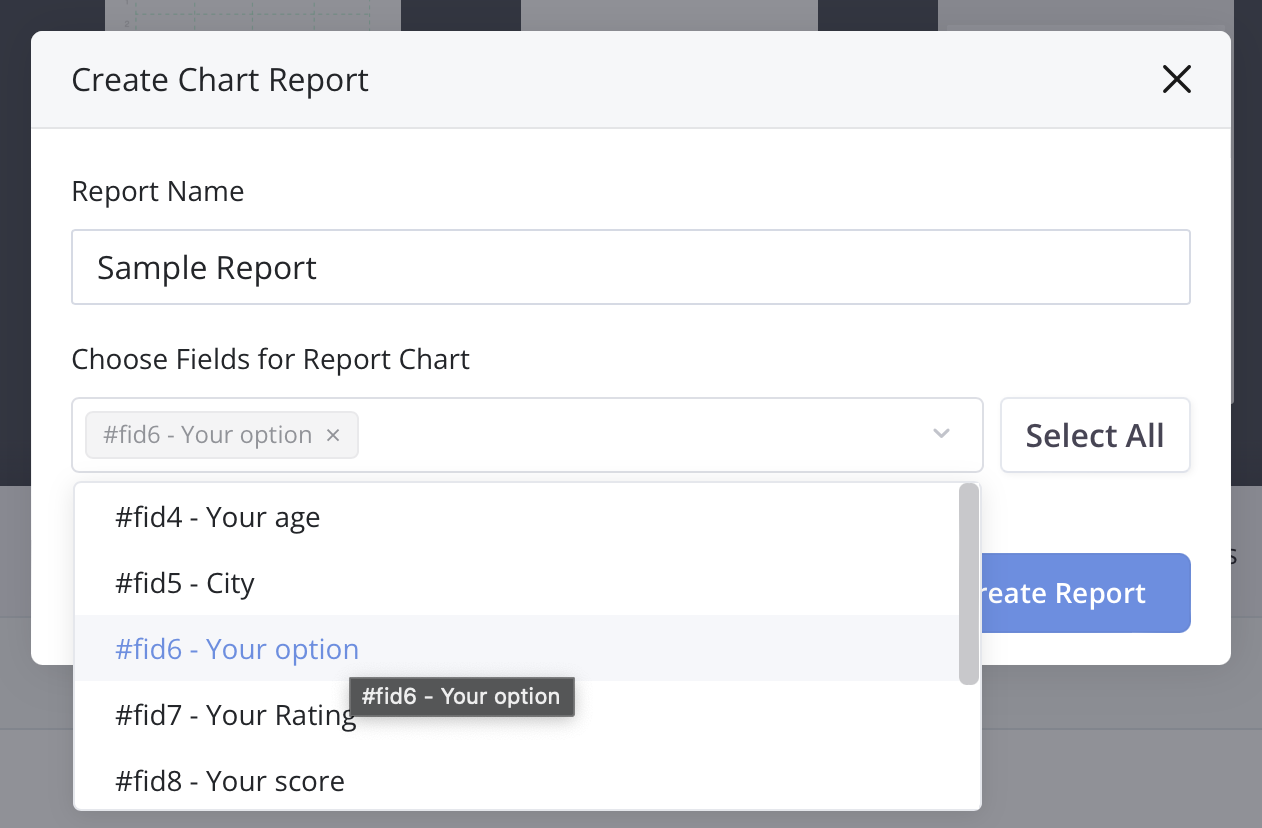
In the window that opens, enter a name for your report, then use the dropdown menu to select the fields you’d like to include in the report. Supported fields include:
- Dropdown
- Choice
- Picture Choice
- Rating
- Slider
- Table
If you want to include all available fields, click Select All.
-
Once you’ve selected the fields, click Create Report.
You’ll open the report page. If there are more than 50 submissions for one form, there may be a delay. You’ll receive an email with a link to access the report when it’s ready.
Understand chart types
PlatoForms supports 6 different chart types for visualizing your data. When the report is first generated, each field’s chart will be assigned a random type. You can change the chart type afterward.
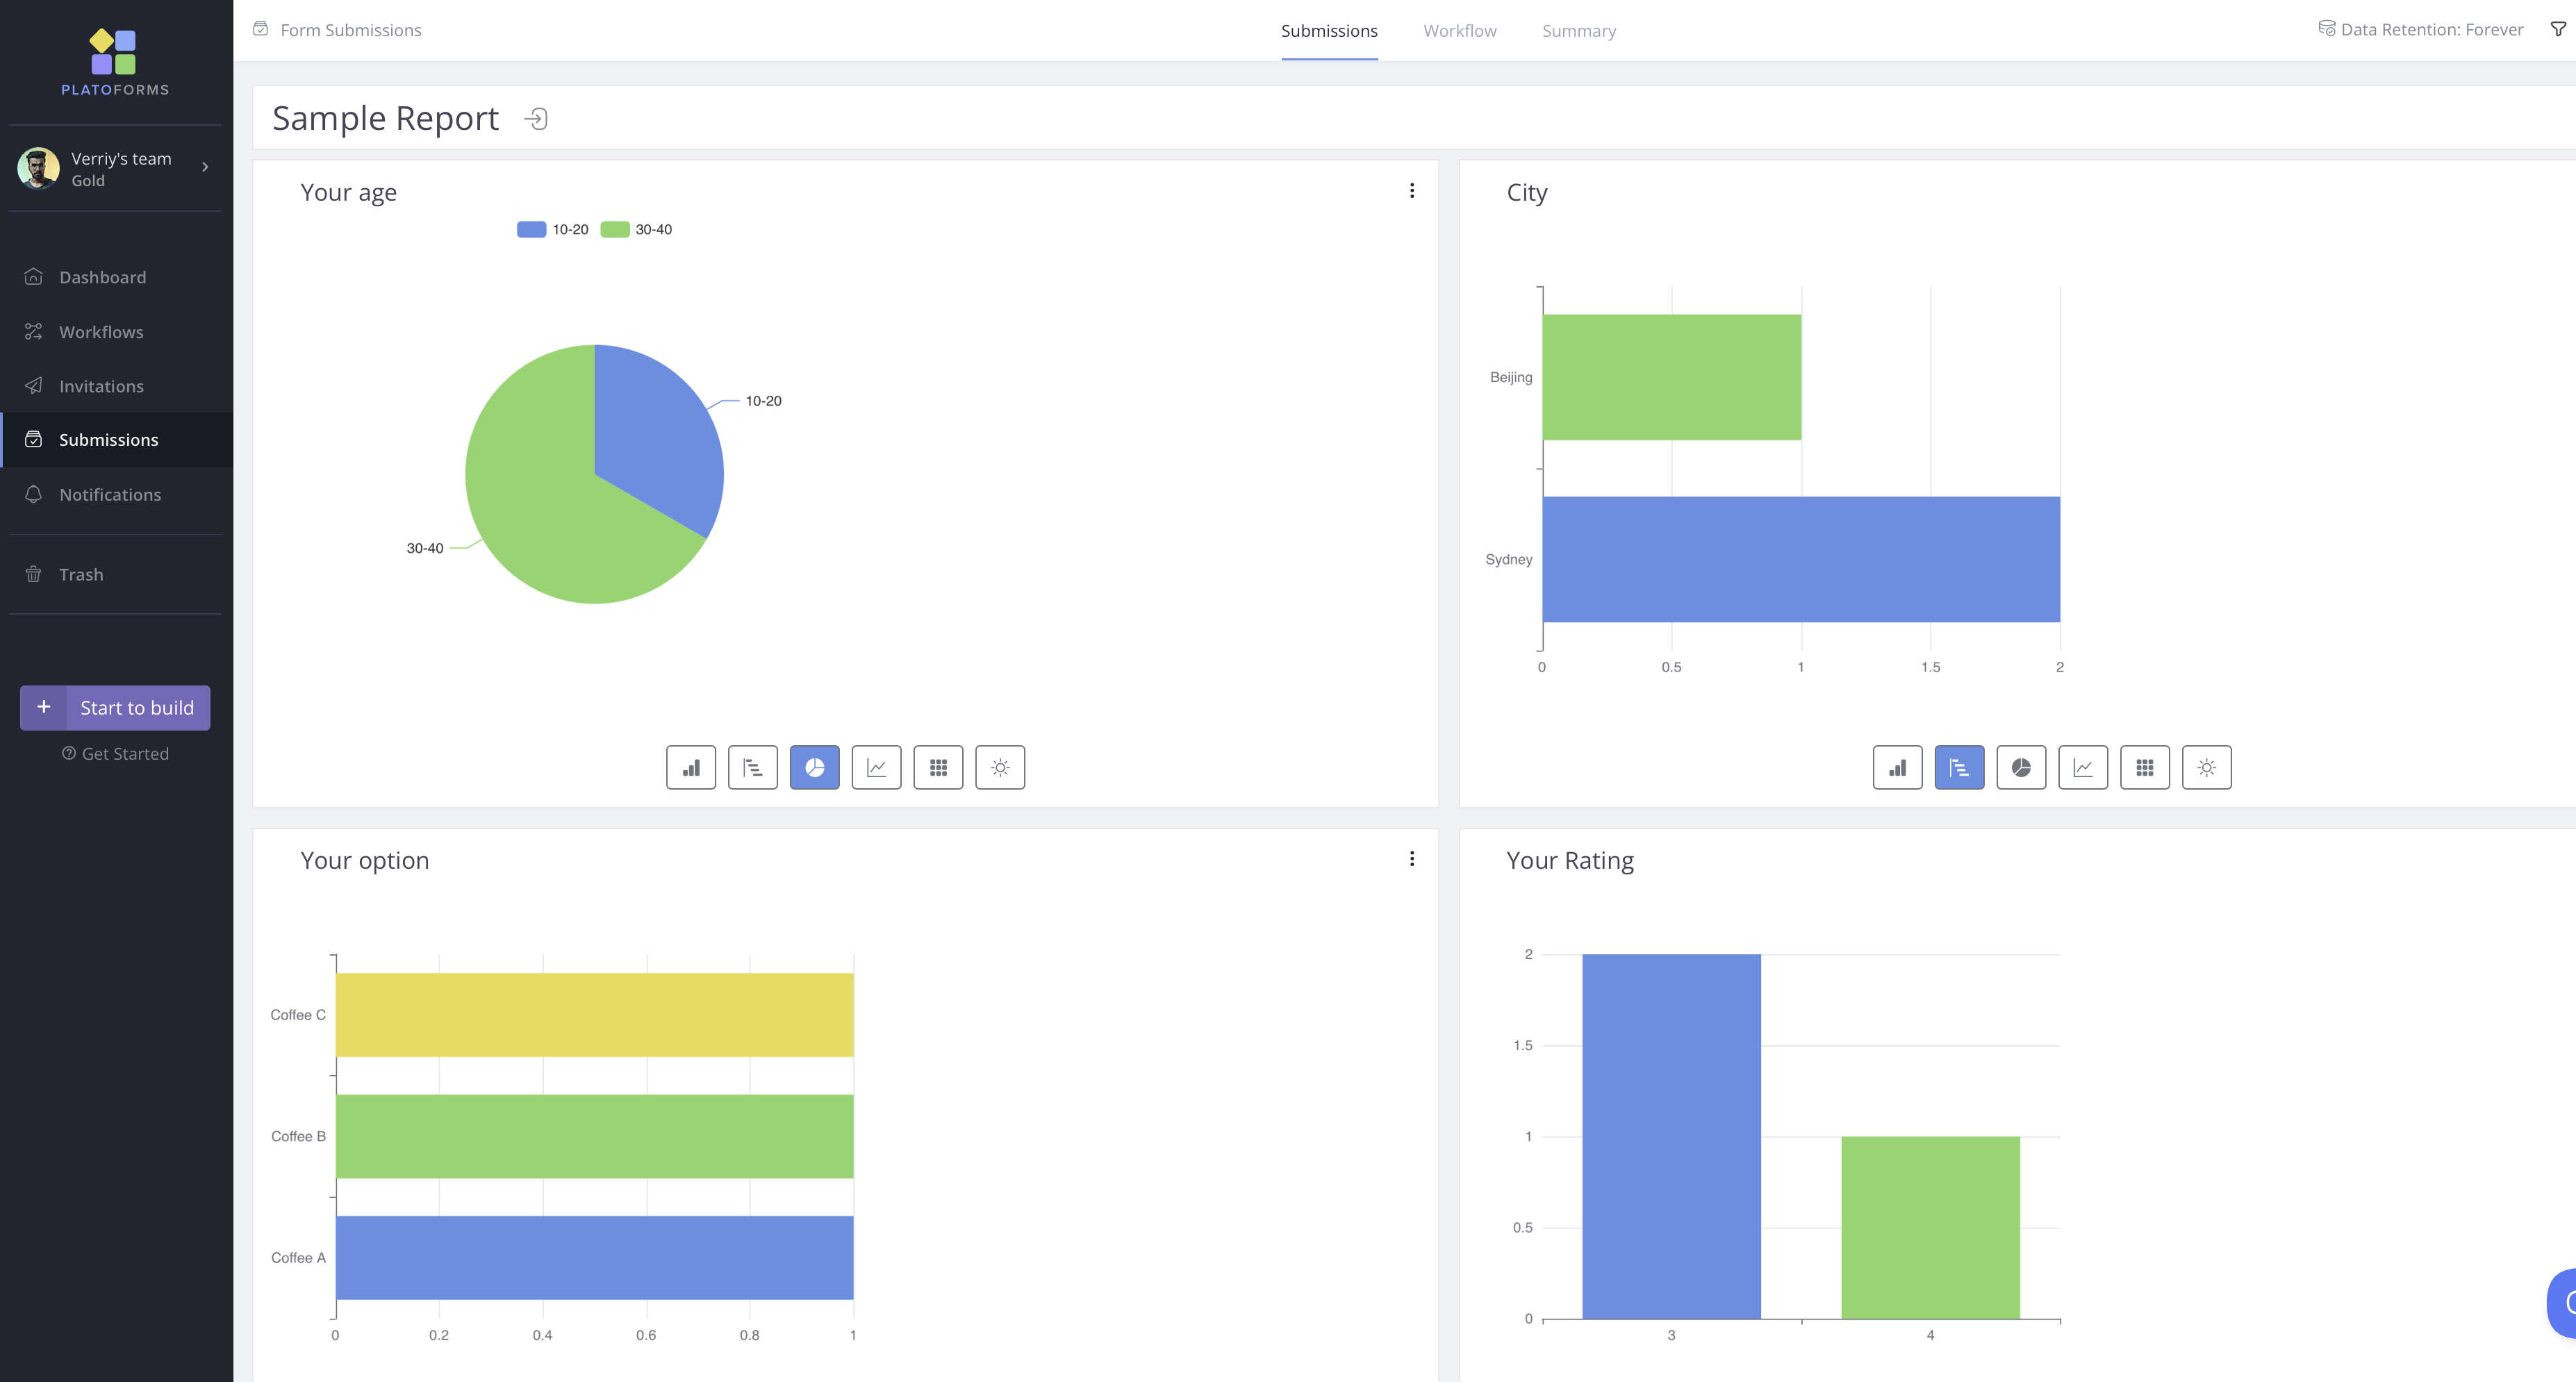
Available chart types include:
- Column: Vertical bars that compare different categories.
- Bar: Horizontal bars that show comparisons between categories.
- Pie: A circle divided into slices to show parts of a whole.
- Line: A line connecting points to show trends.
- Treemap: Boxes within boxes to show parts of a whole in a hierarchy.
- Doughnut: A circle with a hole in the middle, showing parts of a whole like a pie chart.
Once the report is generated, you can customize each chart to suit your preferences.
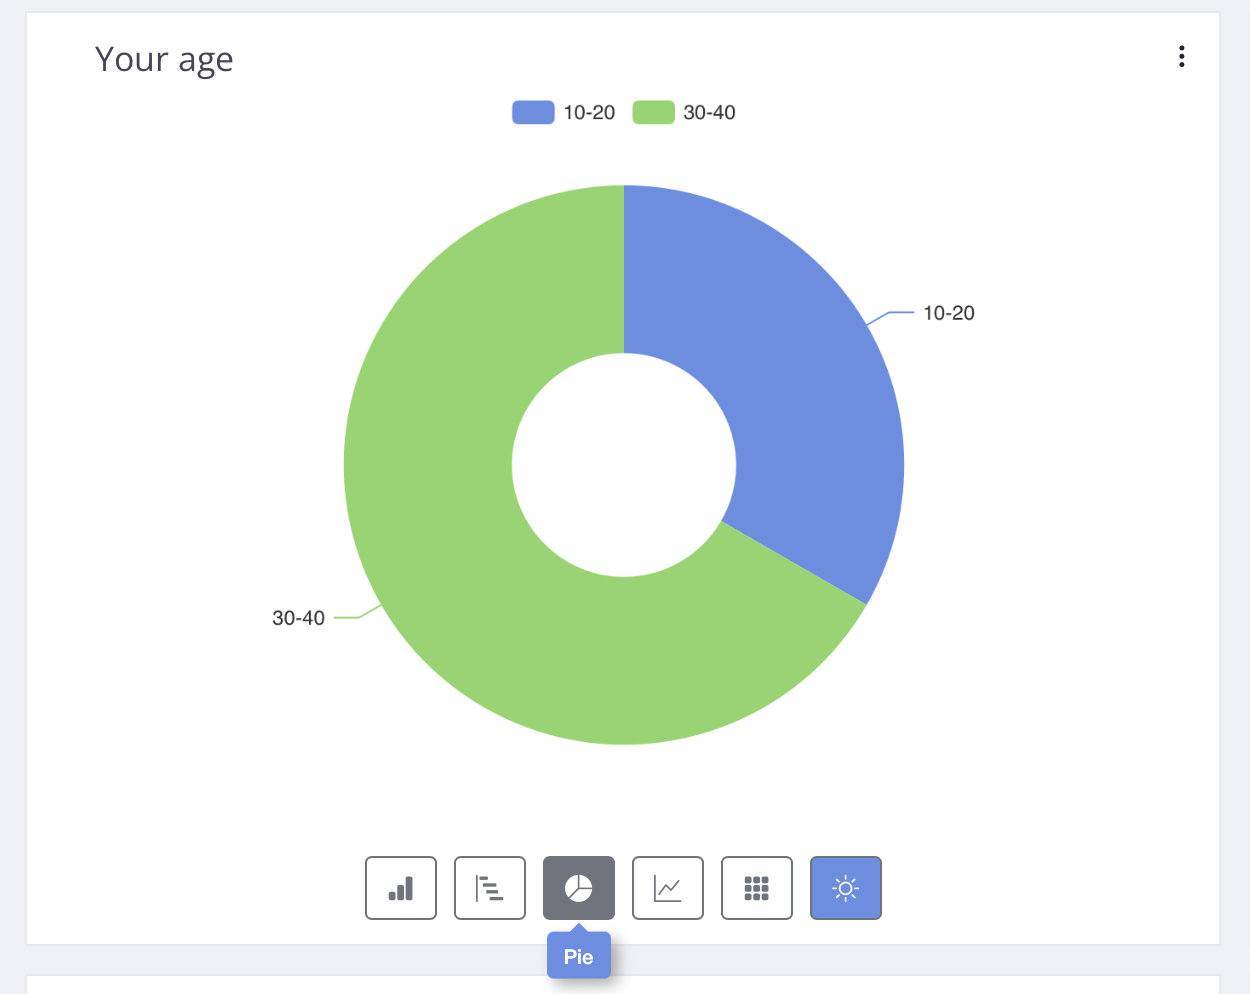
Change chart types
Click on different chart types to switch between the six available options for the data field.
Edit chart
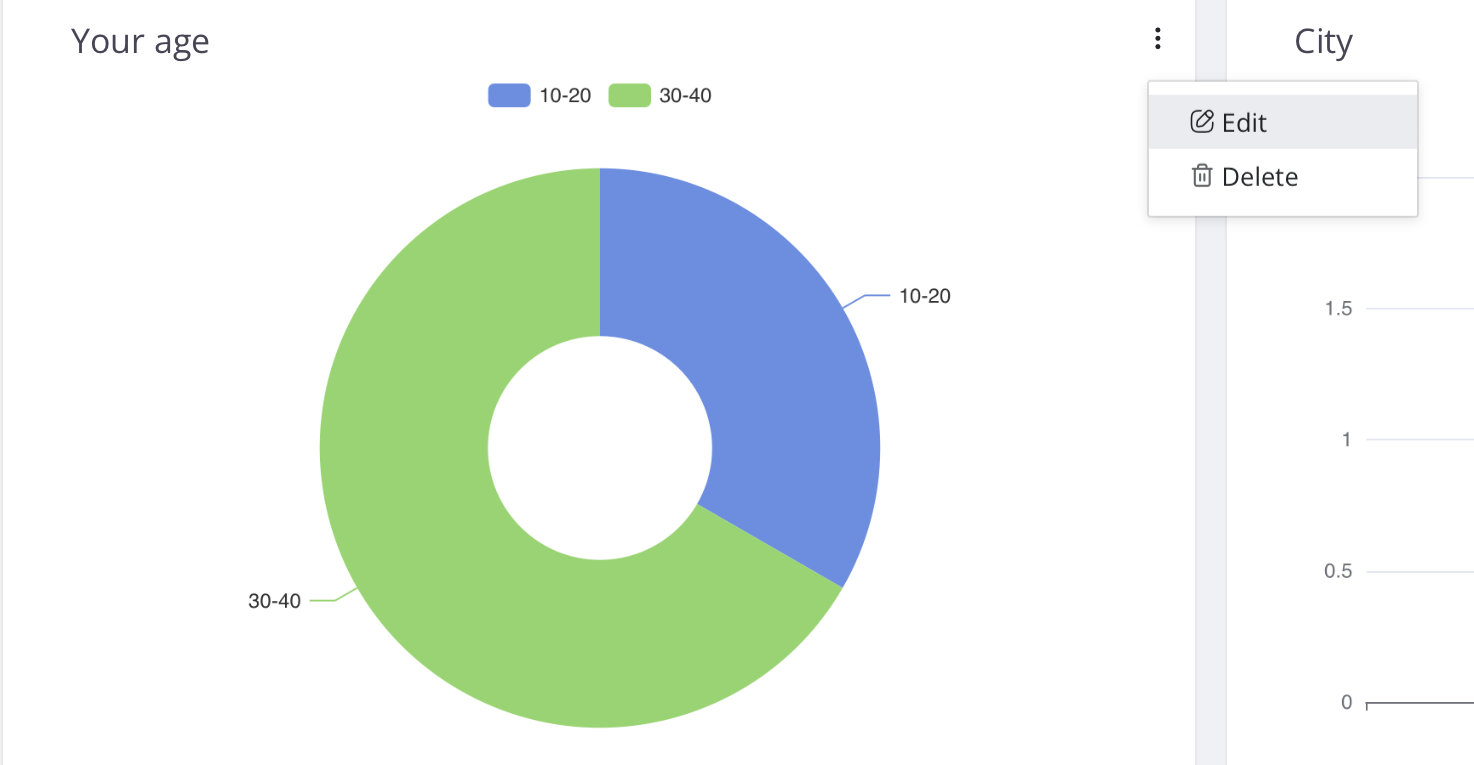
-
In the top right corner of a single chart, click ⋮ > Edit.
-
In the window that opens, you can make the following edits:
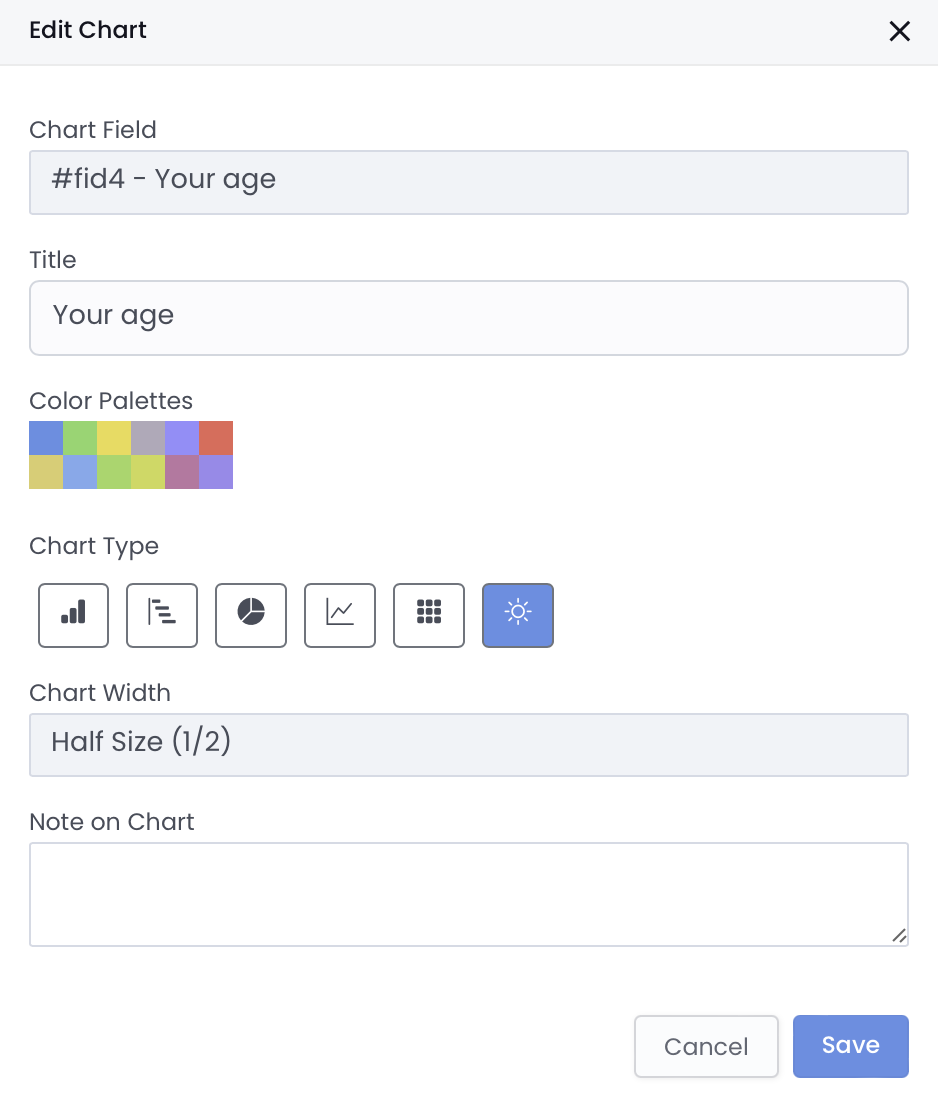
- Chart Field: Select a different field to generate the chart.
- Title: Update the chart title as needed.
- Color Palettes: Choose from pre-set color palettes or customize colors to align with your branding.
- Chart Width: Adjust the width of the chart for improved layout and readability.
-
Click Save to apply your changes.
Add new charts
Even after your report is generated, you can add more charts for existing fields or for additional fields:
-
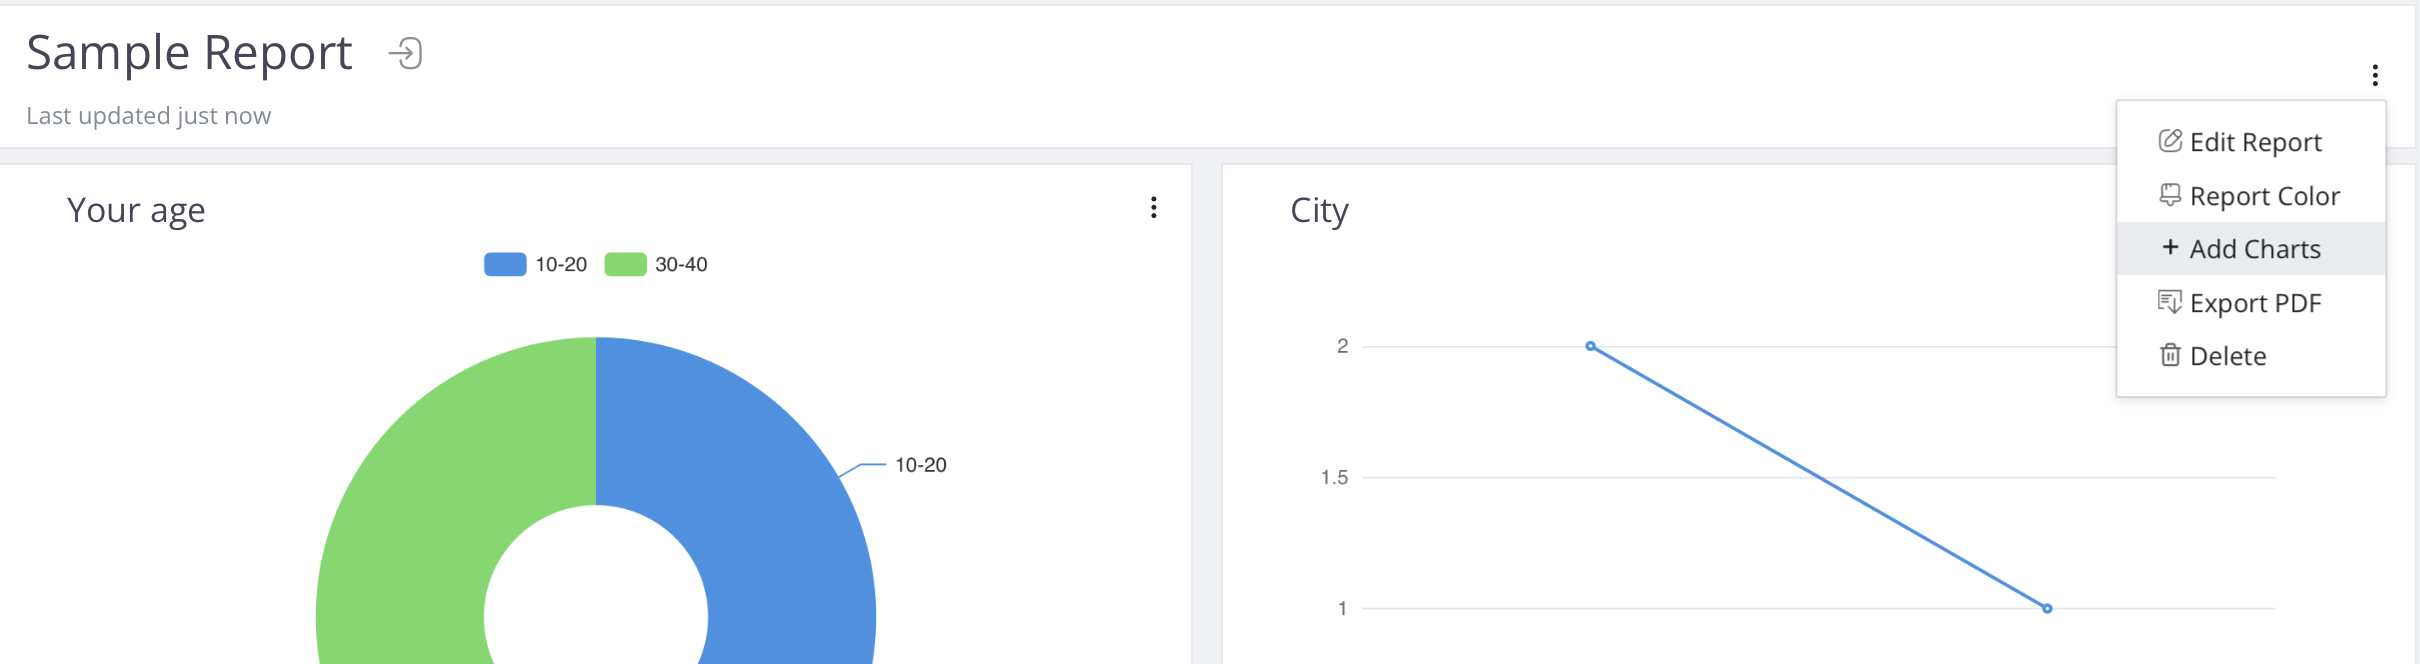
Navigate to the report page.
-
In the top right corner, click ⋮ > Add Charts.
-
Select a field, adjust its settings as needed, and then click Save to add it to your report.
Export report as PDF
Once you’re satisfied with your report, you can easily export it to a PDF for sharing:
-
Navigate to the report page.
-
In the top right corner, click ⋮ > Export PDF.
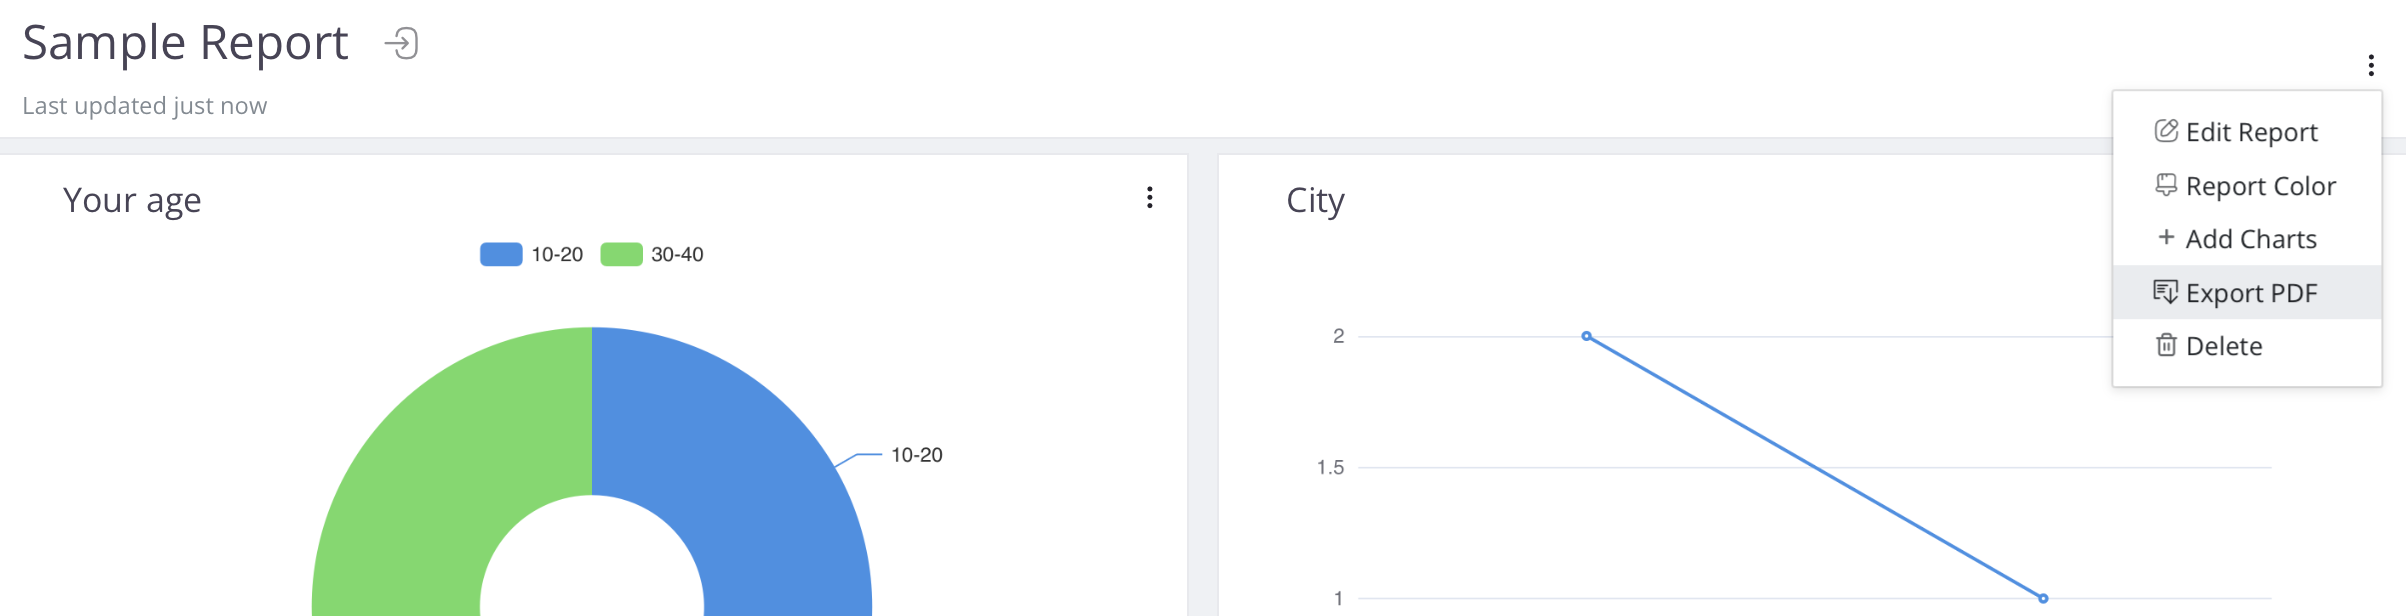
The report will be downloaded to your local machine as a PDF file.